Retail Investor Appeal Engine — Cinematic Output Framework
Score a company the way the general investing public often sees it. Then generate a freaky, multi-layered intelligence dashboard with visuals, rankings, sentiment readings, and AI-style interpretation.
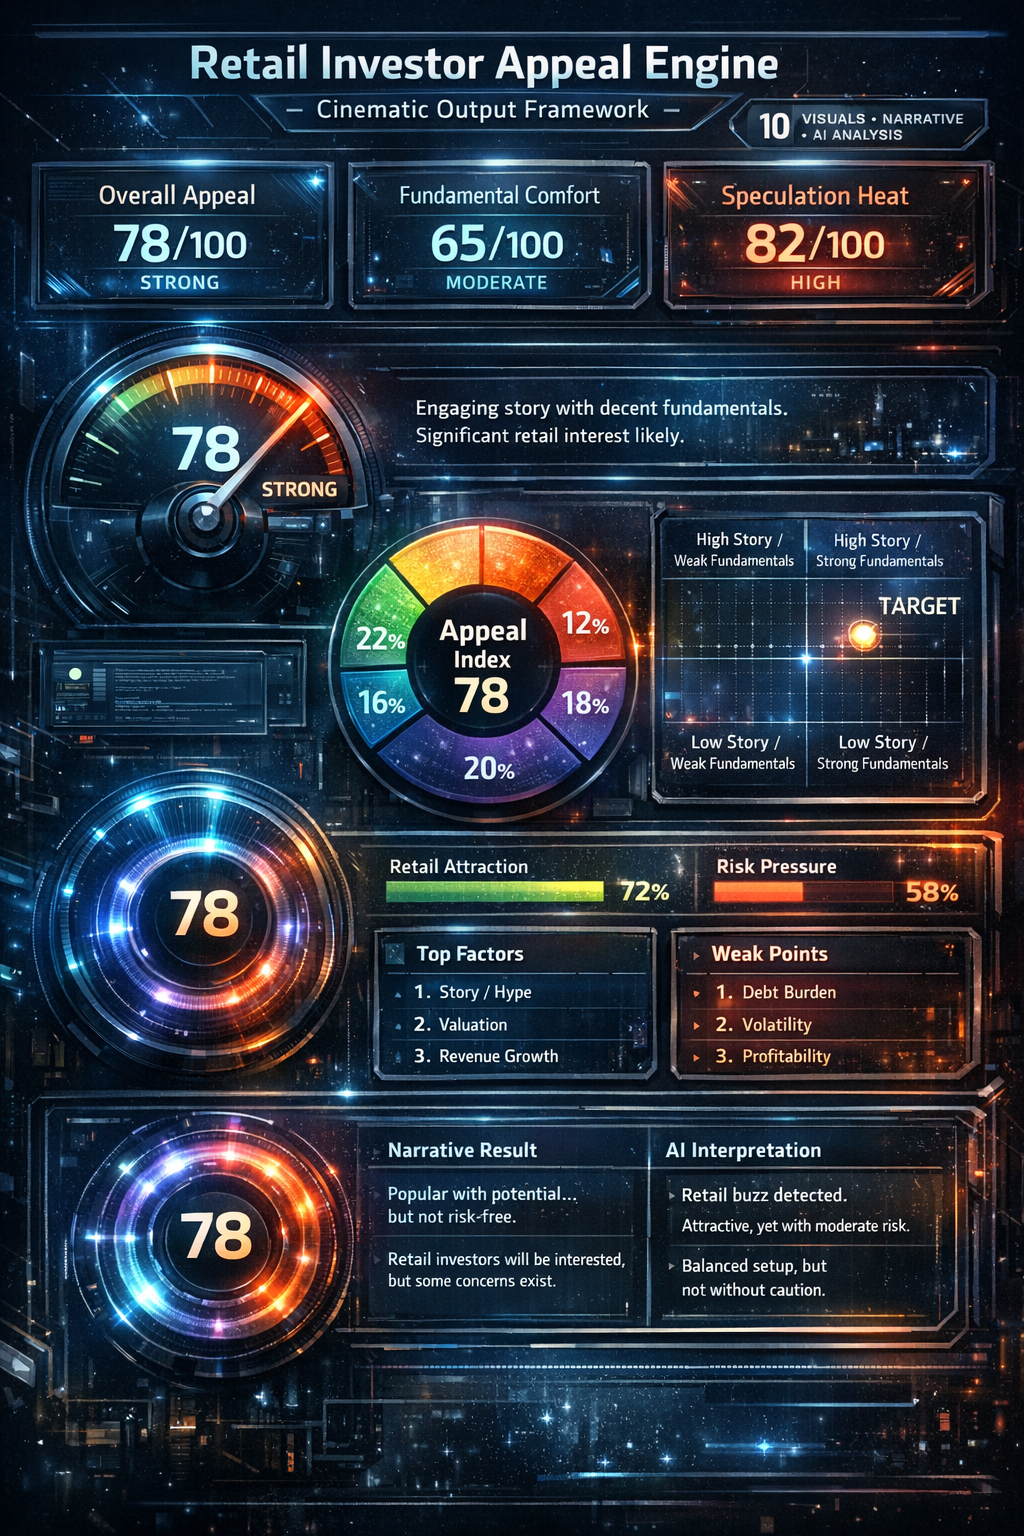
10 VISUAL OUTPUTS • NARRATIVE • AI READING
Company Setup
Input LayerRetail Investor Input Factors
10 Core DriversOutput Layer
Retail Intelligence Dashboard
Overall Retail Appeal
—
Awaiting calculation.
Fundamental Comfort
—
Awaiting calculation.
Speculation Heat
—
Awaiting calculation.
Speedometer Reading
Visual #10
No reading yet
System idle. Generate dashboard to activate readings.
Donut Composition
Visual #20
APPEAL INDEX
Story & Momentum0%
Valuation0%
Business Strength0%
Balance Sheet0%
Ownership / Stability0%
Factor Graph
Visual #3Retail Attraction vs Risk Pressure
Visual #4Retail Attraction
How much the general public is likely to like the setup.
Risk Pressure
How much fear, hesitation, or fragility is sitting underneath the story.
Quadrant Map
Visual #5Target
HIGH STORY / WEAK FUNDAMENTALS
HIGH STORY / STRONG FUNDAMENTALS
LOW STORY / WEAK FUNDAMENTALS
LOW STORY / STRONG FUNDAMENTALS
Quadrant analysis pending.
Heatmap Grid
Visual #6Strongest vs Weakest Factors
Visual #7Strongest
Weakest
Pulse Ring / Sentiment Core
Visual #80
Sentiment core inactive.
Narrative + AI Reading
Visual #9 + #10Narrative Result
Narrative pending.
AI Reading of the Results
AI interpretation pending.