

Bitcoin Cycle Peak Confirmed — But Geopolitics Could Fuel a Final Santa Rally
Bitcoin is widely viewed as having already put in its cycle peak—but short-term dynamics may still favor a reflexive rally.
After reaching an all-time high of $126,210 on October 6, Bitcoin has since corrected roughly 30%, raising the central question now dominating crypto discourse:
Did the bull cycle truly end with the October blow-off top?
Let’s break this down using historical context, current data, and the key technical chart shaping sentiment.
The Case for the Cycle Ending in October
The 2025 rally was exceptional by any standard. It was fueled by record spot ETF inflows, accelerating institutional FOMO, and the classic post-halving momentum traders have come to expect.
However, the speed and magnitude of the post-October drawdown—combined with deteriorating macro conditions—suggest the market may already be transitioning into a new phase.
Key evidence supporting a cycle peak:
- Historical post-halving cycles typically top 12–18 months after the event.
The April 2024 halving followed by an October 2025 peak fits this pattern precisely. - On-chain data points to sustained whale distribution and declining retail participation.
- Institutional sentiment has cooled, with major banks such as Standard Chartered cutting year-end targets—signaling reduced upside conviction.
Technical Damage: The Chart Everyone Is Watching
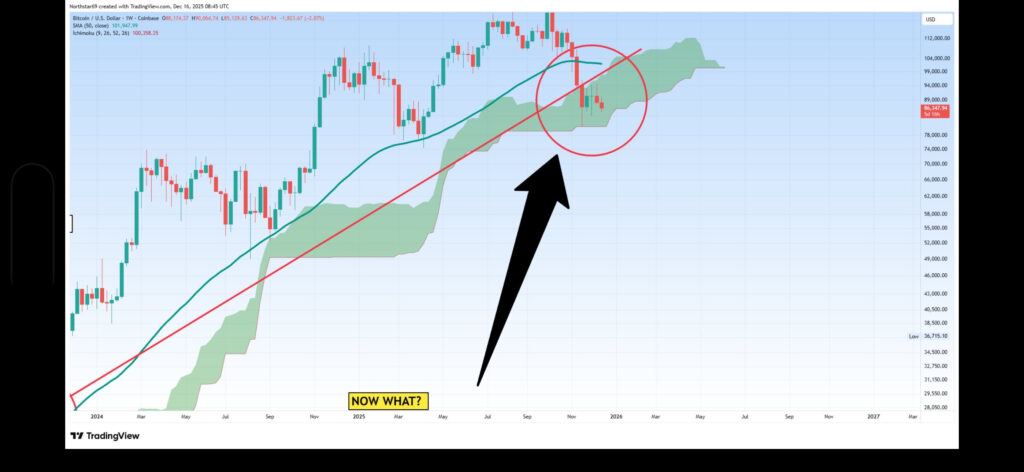
A widely circulated TradingView chart by Northstar69 (posted December 16, 2025) illustrates the technical breakdown clearly.
From the weekly perspective:
- Bitcoin rode a multi-year uptrend channel from the 2024 lows, but that structure has now broken decisively.
- Price was rejected at Ichimoku Cloud resistance late in 2025 (circled area), marking a clear momentum failure.
- Key supports—including SMA(50) near $101K and the Ichimoku base around $100K—have already been breached.
- The thinning cloud ahead suggests volatility expansion, historically resolving lower in similar setups.
- The black arrow and “NOW WHAT?” annotation capture the market’s current uncertainty.
Structurally, this resembles the early phase of a bear-market transition rather than a mid-cycle correction.
Why a Santa Claus Rally Still Makes Sense
Despite the broader trend damage, conditions are lining up for a short-term counter-trend rally, primarily driven by seasonality and geopolitical stress.
Historically, the Santa Claus Rally (late December into early January) has occurred in roughly 70–80% of years since 2014, even during weak macro environments.
Supporting factors include:
- Year-end portfolio rebalancing
- Tax-loss harvesting reversals
- Holiday optimism
- Thin liquidity, which can exaggerate upside moves
Sentiment also argues for a bounce. As of December 17, the Crypto Fear & Greed Index sits at 16 (Extreme Fear)—a level that frequently precedes sharp short-covering rallies, even within downtrends.
Geopolitics: Bitcoin as Modern Capital Flight
One additional factor cannot be ignored: geopolitical instability.
Bitcoin has increasingly become the preferred vehicle for capital flight out of war-torn regions and politically unstable environments. Gold once served this role, but its physical weight and ease of confiscation make it impractical in modern crises.
Bitcoin, by contrast, allows individuals to move millions of dollars on a small electronic device, pass through borders, and re-establish liquidity elsewhere.
Historically, this dynamic tends to:
- Create sharp, sudden inflows into Bitcoin
- Spike price temporarily
- Be followed by selling pressure, as holders convert BTC into local currency in their destination country
These inflows are powerful—but typically short-lived.
Technical Expectation: One More Push, Then Lower
With price already significantly corrected and sentiment deeply oversold, a reflexive rally is technically plausible.
A retest of the underside of the former uptrend channel—now acting as resistance—is a classic post-breakdown pattern.
My expectation:
- Bitcoin rallies toward $100K–$105K, potentially higher if geopolitical tensions intensify
- That level confirms former support as new resistance
- Selling pressure resumes, opening the door to deeper lows in 2026
Final Thoughts: Cycle Top Likely In, But One Last Holiday Bounce
October very likely marked the euphoric peak of this cycle.
While the market structure has evolved with greater institutional participation, the current drawdown feels like the early stages of a true bear market, not a temporary reset.
That said, seasonality, sentiment extremes, and geopolitical capital flows may still fuel one final Santa-style bounce before the larger downtrend reasserts itself.
What’s your take—quick holiday rally followed by lower lows, or something more durable?
Sound off in the comments.
Disclaimer: This is not financial advice. Crypto markets are highly volatile.