
A Betweenplays Media Educational Feature 🎙️
Where clarity meets conviction — and real investors learn to see beyond the numbers.
Introduction — The Signal Beneath the Noise
In a world where headlines move billions and social platforms ignite panic with every post, few investors stop to ask the most fundamental question in finance:
“What does this number really mean?”
Markets rise and fall on speculation, emotion, and algorithms.
But behind the noise lies the quiet, consistent power of dividends and yields — two metrics that together tell the story of value, trust, and time.
Dividends are the truth of corporate strength.
Yields are the translation of that truth into market psychology.
To master both is to understand the rhythm of real wealth.
Part I — Why Dividend Stocks Remain the Core of Serious Investing
Dividend-paying companies don’t just promise growth — they deliver cash flow.
They are businesses that:
- Generate steady profits,
- Allocate capital responsibly, and
- Reward shareholders for patience, not hype.
In essence, dividends are proof of life — evidence that the business is producing something tangible.
Why they matter:
- They provide income in volatile markets.
- They instill discipline in management.
- They allow compounding through reinvestment.
As John D. Rockefeller famously said:
“Do you know the only thing that gives me pleasure? It’s to see my dividends coming in.”
Every serious investor eventually discovers that wealth isn’t built from motion — it’s built from repetition, reliability, and reinvestment.
Part II — The Power of Yield: Where Company and Market Intersect
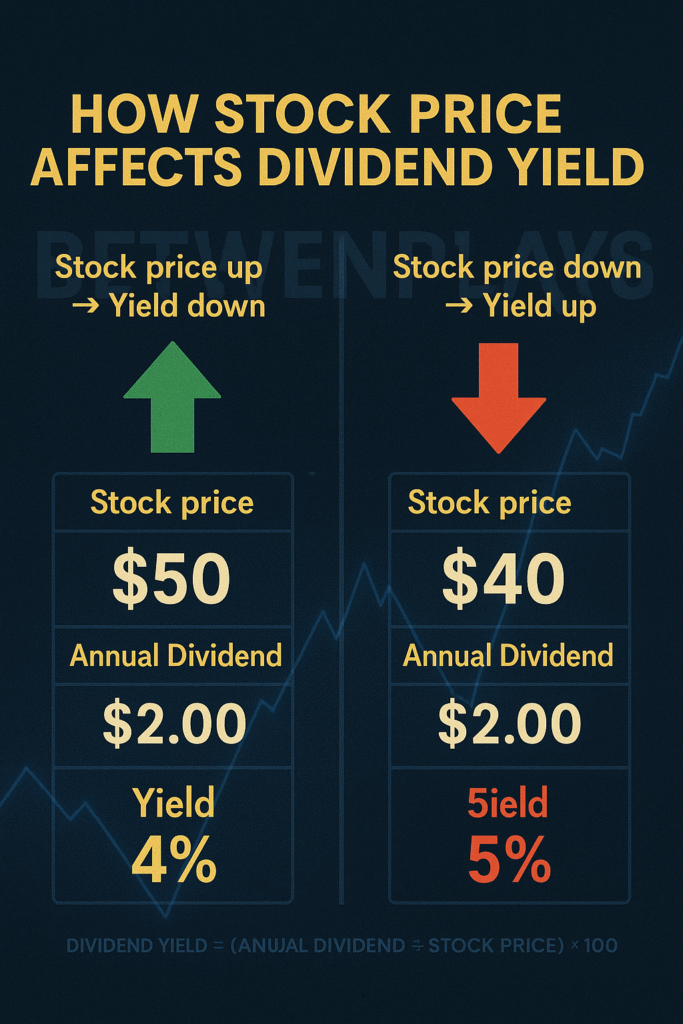
The dividend is set by the company.
The yield is set by the market.
The Formula
\text{Dividend Yield} = \frac{\text{Annual Dividend per Share}}{\text{Current Share Price}} \times 100
Now, let’s see how this plays out in real terms.
| Stock Price | Annual Dividend | Dividend Yield |
| $100 | $2 | 2% |
| $50 | $2 | 4% |
| $20 | $2 | 10% |
| $4 | $2 | 50% |
The dividend stays constant, but the yield moves because the stock’s price changes.
At $50, you earn 4%.
At $20, you earn 10%.
At $4, it looks spectacular — but that’s often where investors get trapped.

A 50% yield doesn’t mean the company is thriving; it usually means the market is signaling distress.
The key is learning when yield reflects opportunity and when it reflects risk.
Part III — The Market’s Mirror: When Yield Lies and When It Tells the Truth
A yield isn’t a guarantee — it’s a snapshot of sentiment.
It doesn’t tell you how the company is doing; it tells you what the market currently believes about it.
- If the stock price falls because of fear or broad market panic, yield rises — even if nothing inside the company has changed.
- If the price rises because of optimism, yield falls — even if the company is paying the same dividend.
That’s why yield is both a signal and a trap.
It reflects perception, not performance.
The skilled investor asks:
“Why did the yield change?”
Not just:
“What is the yield right now?”
Part IV — The Age of Noise: When Tweets Move Markets
Modern markets react faster than ever before.
An executive’s post on X, a central bank speech, or a single political headline can move global valuations in minutes.
But here’s the reality: none of that changes a company’s cash flow overnight.
Example:
Johnson & Johnson pays roughly $4.76 per share in dividends.
At $160 per share, that’s a 2.97% yield.
If a healthcare headline drops the stock to $145:
\frac{4.76}{145} \times 100 = 3.28\%
The yield spikes — but J&J’s profits, operations, and patient base haven’t changed.
In this era of headline volatility, yields fluctuate constantly — not because companies are changing, but because investors are reacting.
Part V — The Analyst’s Path: How Professionals Verify the Truth Behind the Yield
When a yield looks appealing, that’s your invitation to investigate.
The process below mirrors what a Chartered Accountant or financial analyst would perform before taking any yield at face value.
Step 1: Payout Ratio (EPS vs Dividend)
\text{Payout Ratio} = \frac{\text{Dividend per Share}}{\text{Earnings per Share}} \times 100
This measures how much of a company’s profit is paid out as dividends.
- 🟢 Below 50% → Healthy and conservative.
- 🟡 50–75% → Acceptable for stable industries.
- 🔴 Above 100% → Unsustainable — likely a dividend cut ahead.
Example:
If EPS = $5, Dividend = $2 → 2 ÷ 5 × 100 = 40\%.
Stable.
If EPS = $1.50, Dividend = $2 → 133\%.
Red flag.
Step 2: Free Cash Flow (FCF)
\text{FCF} = \text{Operating Cash Flow} – \text{Capital Expenditures}
Then:
\text{FCF Payout Ratio} = \frac{\text{Dividends Paid}}{\text{Free Cash Flow}} \times 100
This confirms whether the company is paying dividends out of real cash — not borrowed funds.
EPS can be distorted by accounting adjustments; cash flow doesn’t lie.
Step 3: Debt & Liquidity
- Debt-to-Equity Ratio
- Interest Coverage Ratio (EBIT ÷ Interest Expense)
Rising debt with flat cash flow is a ticking time bomb for dividends.
Step 4: Dividend History
Past consistency predicts future reliability.
If the company maintained or grew dividends through 2008 or 2020, that’s managerial discipline.
Step 5: Peer Comparison
Compare within industry context:
- Utilities → high payout ratios are normal.
- Tech → lower payouts expected (reinvestment priority).
- REITs → use FFO (Funds From Operations), not EPS.
Part VI — Example of a Complete Dividend Analysis
Company GHI
- Dividend Yield: 6%
- EPS: $5.00
- Dividend: $2.00 → Payout Ratio = 40% ✅
- FCF: $700M, Dividends Paid: $400M → 57% ✅
- Debt/Equity = 0.7, Interest Coverage = 6× ✅
- 12 consecutive years of dividend increases ✅
Verdict: Sustainable yield. Stable foundation. Market likely undervalued the stock.
Part VII — Macro vs Micro: Separating Reality from Reaction
| Level | Definition | Effect on Yield |
| Macroeconomic | External factors — interest rates, inflation, wars, sentiment | Moves price, not fundamentals |
| Microeconomic | Company factors — earnings, cash flow, payout ratio | Determines ability to sustain dividend |
When the yield moves but the company hasn’t changed, it’s macro.
When both move together, it’s micro — and that’s when to dig deeper.
Part VIII — The Math of Mispricing
A stable company with a $2 dividend trading at $40 shows a 5% yield.
If panic drives it to $30:
\frac{2}{30} \times 100 = 6.67\%
Nothing changed inside the company.
The world just handed you a higher return for the same risk.
That’s the quiet advantage of dividend logic: you profit from other people’s impatience.
Part IX — The Real-World Meaning of Yield (and Why It’s Often a Lie)
Dividend yield is the most quoted — and most misunderstood — metric in modern investing.
You see it displayed beside every stock ticker as if it were a fixed promise.
In truth, it’s a moving snapshot, not a corporate commitment.
Here’s how yields appear — and what they actually mean in context.
| Yield | Surface Translation | Typical Companies | Real Risk Interpretation |
| 1–2% | Growth-focused, reinvesting profits | Tech, healthcare | Low yield = company reinvesting heavily. You’re betting on future growth, not income. |
| 3–5% | Balanced income & growth | Banks, telecoms, utilities | Often the sweet spot — stable, steady, and well-covered by earnings. |
| 6–8% | High income, moderate risk | REITs, pipelines, mature funds | Attractive, but requires due diligence. Could be genuine income or a prelude to strain. |
| 10%+ | Market distress | Troubled firms, overleveraged businesses | Usually not a gift — a signal of danger. The market expects a dividend cut. |
| 50% | Unrealistic fantasy | Collapsing companies | Mathematical illusion — yield inflated by a crashing stock. A trap, not an opportunity. |
Why This Matters
These percentages are mathematically true but economically deceptive.
A 10% yield doesn’t mean the company is more generous — it often means the stock is collapsing.
If a company pays $2 annually and its stock crashes from $40 to $4:
\frac{2}{4} \times 100 = 50\%
The number is real; the message is false.
No company can sustain that. It’s a warning, not a reward.
The Professional Interpretation
Dividend yield is a thermometer — not a climate report.
It measures the market’s temperature, not the company’s weather system.
Professionals know this and use yield as a trigger for investigation, not a measure of trust.
“A high yield isn’t a gift. It’s a question.”
Part X — Professional Q&A Section
Q1: If a company pays a 4% dividend but the stock price moves, what happens?
The yield changes; the payout does not.
It’s the market, not the company, that adjusts the percentage.
Q2: If yield rises, is that bad news?
Not automatically.
It can signal opportunity if fundamentals are stable — or danger if earnings are falling.
Always verify.
Q3: What should I check first after seeing a high yield?
Earnings per share (EPS), to ensure the payout is covered by profits.
Q4: What’s the best measure of true stability?
Free Cash Flow — because it shows real money left to pay shareholders after operations and investments.
Q5: Can macro factors make yield misleading?
Absolutely.
Yields often spike due to fear, headlines, or political noise — not corporate weakness.
Q6: What’s the verification order professionals use?
1️⃣ Yield (as signal)
2️⃣ EPS (profit coverage)
3️⃣ FCF (cash coverage)
4️⃣ Debt metrics
5️⃣ Dividend history
6️⃣ Industry comparison.
Q7: How do social media and modern sentiment affect this?
They accelerate irrational pricing.
A tweet can distort valuation — but yield helps you detect when emotion has gone too far.
Q8: What’s the investor’s advantage in that chaos?
You earn while others react.
Dividends convert fear into opportunity.
Part XI — The Synthesis: Dividends and Yields Are Two Sides of the Same Coin
- Dividends tell you what the company is doing.
- Yields tell you what the market thinks about what it’s doing.
One is the truth.
The other is the reaction.
When those two diverge, that’s where the smart money moves — quietly, patiently, and profitably.
Final Reflection — Betweenplays Viewpoint
At Betweenplays Media 🎙️, we believe that true investing mastery begins when emotion ends and logic begins.
Dividends and yields together form the hidden code of real wealth — one rooted not in noise or speculation, but in consistency, cash flow, and courage.
A 6% yield means nothing until you understand its foundation.
A 2% yield can mean everything if it’s backed by decades of trust.
In the modern market, where news cycles blur judgment and algorithms amplify fear, it’s the investor who reads beyond the number who wins.
Dividends are the heartbeat.
Yields are the pulse.
Together, they tell you whether the market’s body is healthy — or just panicking.
And those who can interpret that rhythm?
They’re not just investors.
They’re architects of time.
🟡 Betweenplays Media 🎙️
Research. Prepare. Plan. Execute.
Because real investing begins where noise ends.