How can the United States of America continue creating wealth out of thin air and not reap the repercussions of such actions, will it be too late when we decide to get out or do we get out on top.

You see, this question of getting out on a high before you hold on just a little too long and getting out on a low, is a question that is asked of oneself throughout the ages, go ask people like; Micheal Jordan, Georges St-Pierre, Wayne Gretzky, Lionel Messi and Ronaldo! When is the right time to stop, when is it the right time to say to yourself, I should get out now and just wait and see, this is a good amount, I accomplished my goal in this area and now its time to set up another goal, I know somethings coming and with this, I have accomplished what I needed to accomplish…
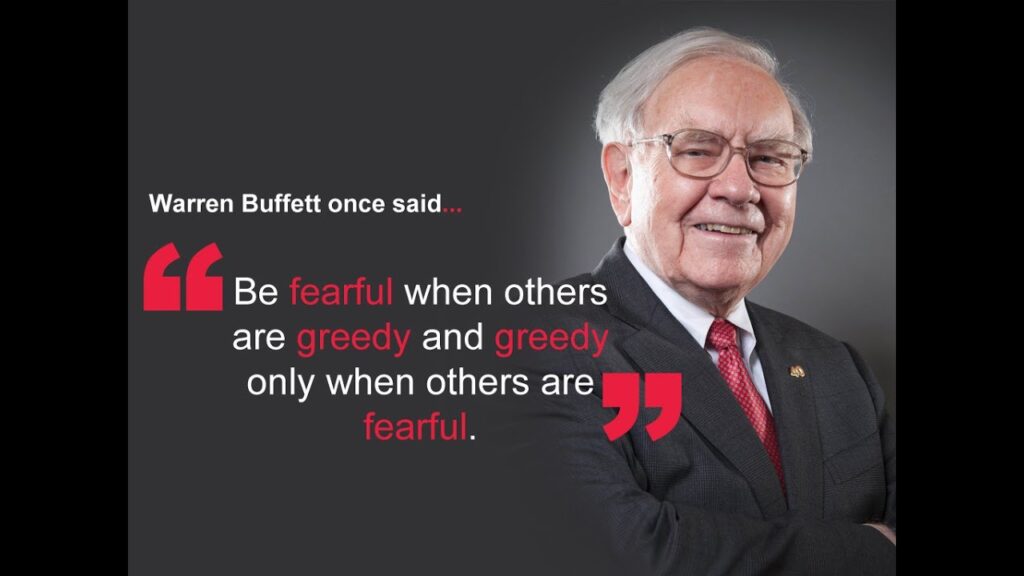
I guess one should look at their lifestyle, what they need to pay off, how much should they leave in, what stocks to invest into in order to ride out a crash and how much should be invested in those specific stocks and then buy the dip when the Market does crash, like Warren Buffet says; “…be greedy when others are fearful…”! Where are we in the market right now, with its all time highs all over the place, the S&P500 just reached over 4000 the other day as the Dow and Nasdaq continue beating record highs or how about bitcoin at insane record highs over 72 000$, I would say we are in a greedy market at this moment, can we continue to create this money, the stimulus checks and feed it to the public for consumption or will it stop – and then what?! Will we one day wake up to insane inflation?!

Look, the debt in the USA is very big but not the biggest one out there, the USA is moving up on Italy, some debt is healthy, it keeps one moving and growing but then there is other types of debts that can just take your knees out.
Let us explain the two in one simple example:

Compare the two types of debt: A bigger TV in the TV room from a 55 to 65 inch just because you want it or getting yourself a drivers license and putting them both on a credit card; when it comes to the TV, it is completely unnecessary to purchase the wider screen TV but people do this all the time, versus investing in oneself, for example, education or a drivers licence, having a drivers licence opens up the door to further job opportunities as a driver of sorts or getting that job thats 25 kilometres away that pays very well; one type of debt is wasteful whereas the other contributes to inner and external growth.
All these types of debts taken into account is wise and we must then factor in GDP (Gross Domestic Product) what it is we are creating as wealth basically, because even nations have good and bad debt, it is the ratio which creates or contributes to the GDP that matters most and the Debt to GDP ratio as a conclusion. According to the World debt Clocks/National Debt Clock, the USA has a population of 330 269 808 million people, their national debt at the time I am writing this is 28 128 020 222 000 trillion dollars, their GDP at the time of writing this is 21 645 449 500 000 trillion dollars, the Public debt to GDP ratio is 102.32% and their external debt to GDP ratio was 129.30% if you look at the percentage area alone without taking in to account other factors, the USA is similar percentage wise to the Canada, Spain and Italy, ok let us take a look at the the similarities, for each country we will look at the Public debt to GDP ratio in the first column and then the external debt to GDP ratio:

Public debt to GDP ratio
USA 102.32%
Canada 111.42%
Italy 165.25%
Spain 123.94%
China 53.99%
Russia 18.41%
Greece 238.99%
External debt to GDP ratio
USA 129.30%
Canada 135.80%
Italy 151.09%
Spain 188.05%
China 12.86%
Russia 38.58%
Greece 302.88%
Greece has the highest balanced Public debt to GDP ratio and External Debt to GDP ratio and we know how hard they have been hit a few times in the last 20 years, I guess we can use them as a marker as to when it gets really bad. So when do we start getting concerned about these numbers especially when you start comparing them to China and Russia, especially China, who is to pass the United States of America’s as the economical world leader by 2028 with hardly any debt but with continued sustained growth internally and externally.
Basically, the debt, infrastructure, manufacturing is all going to be a factor on the market, whether a crash will occur in the near future or far future and it all depends on the one big macroeconomic factor of all, POLITICS, what political stance will the USA take on international relations with China!,

Be awake for this one because the market is shaky and very dependent on the next chess move, in the last 40 years the USA was a leader in world affairs especially after the fall of the USSR, by 2009 not one country could compare to the USA’s economical and military power but in all of history, the world has only had room for one world power and as China continues this sustained growth, it may want to once again be the leading world power; as one stands the other falls!
SIGN UP TO OUR YOUTUBE AND TWITTER ACCOUNTS

Betweenplays is a Stock Entertainment Channel and we do not give out financial advise, if you are in need of financial advise please seek a professional financial advisor.
Our Motto: Research Prepare Plan Execute! Stay Strong!

